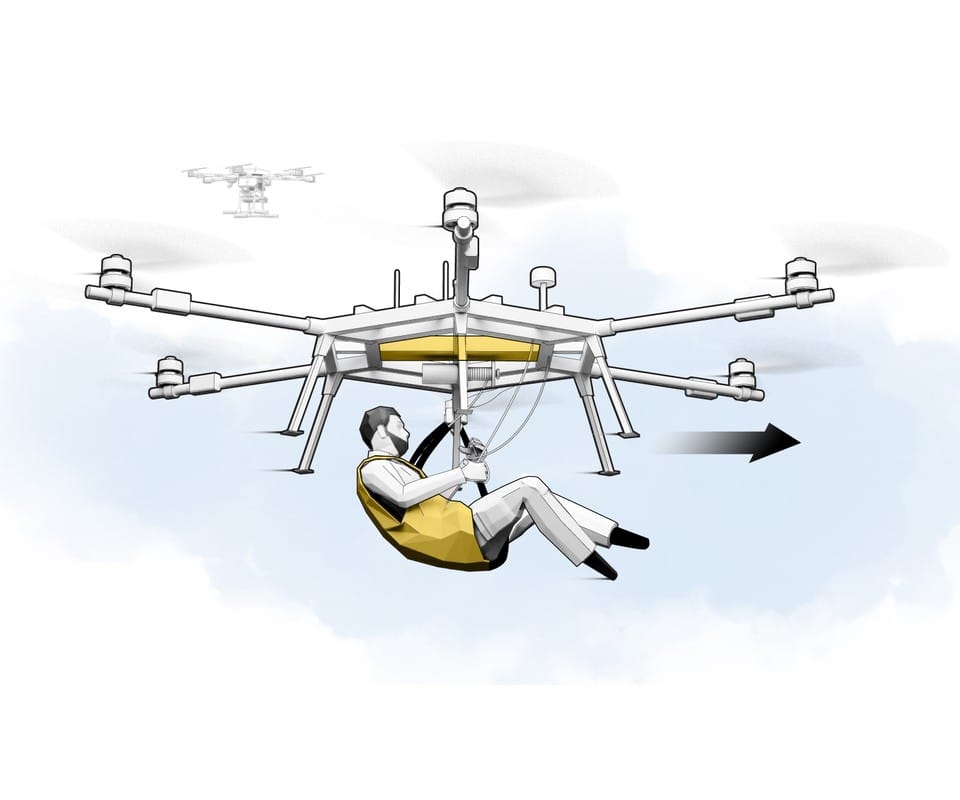
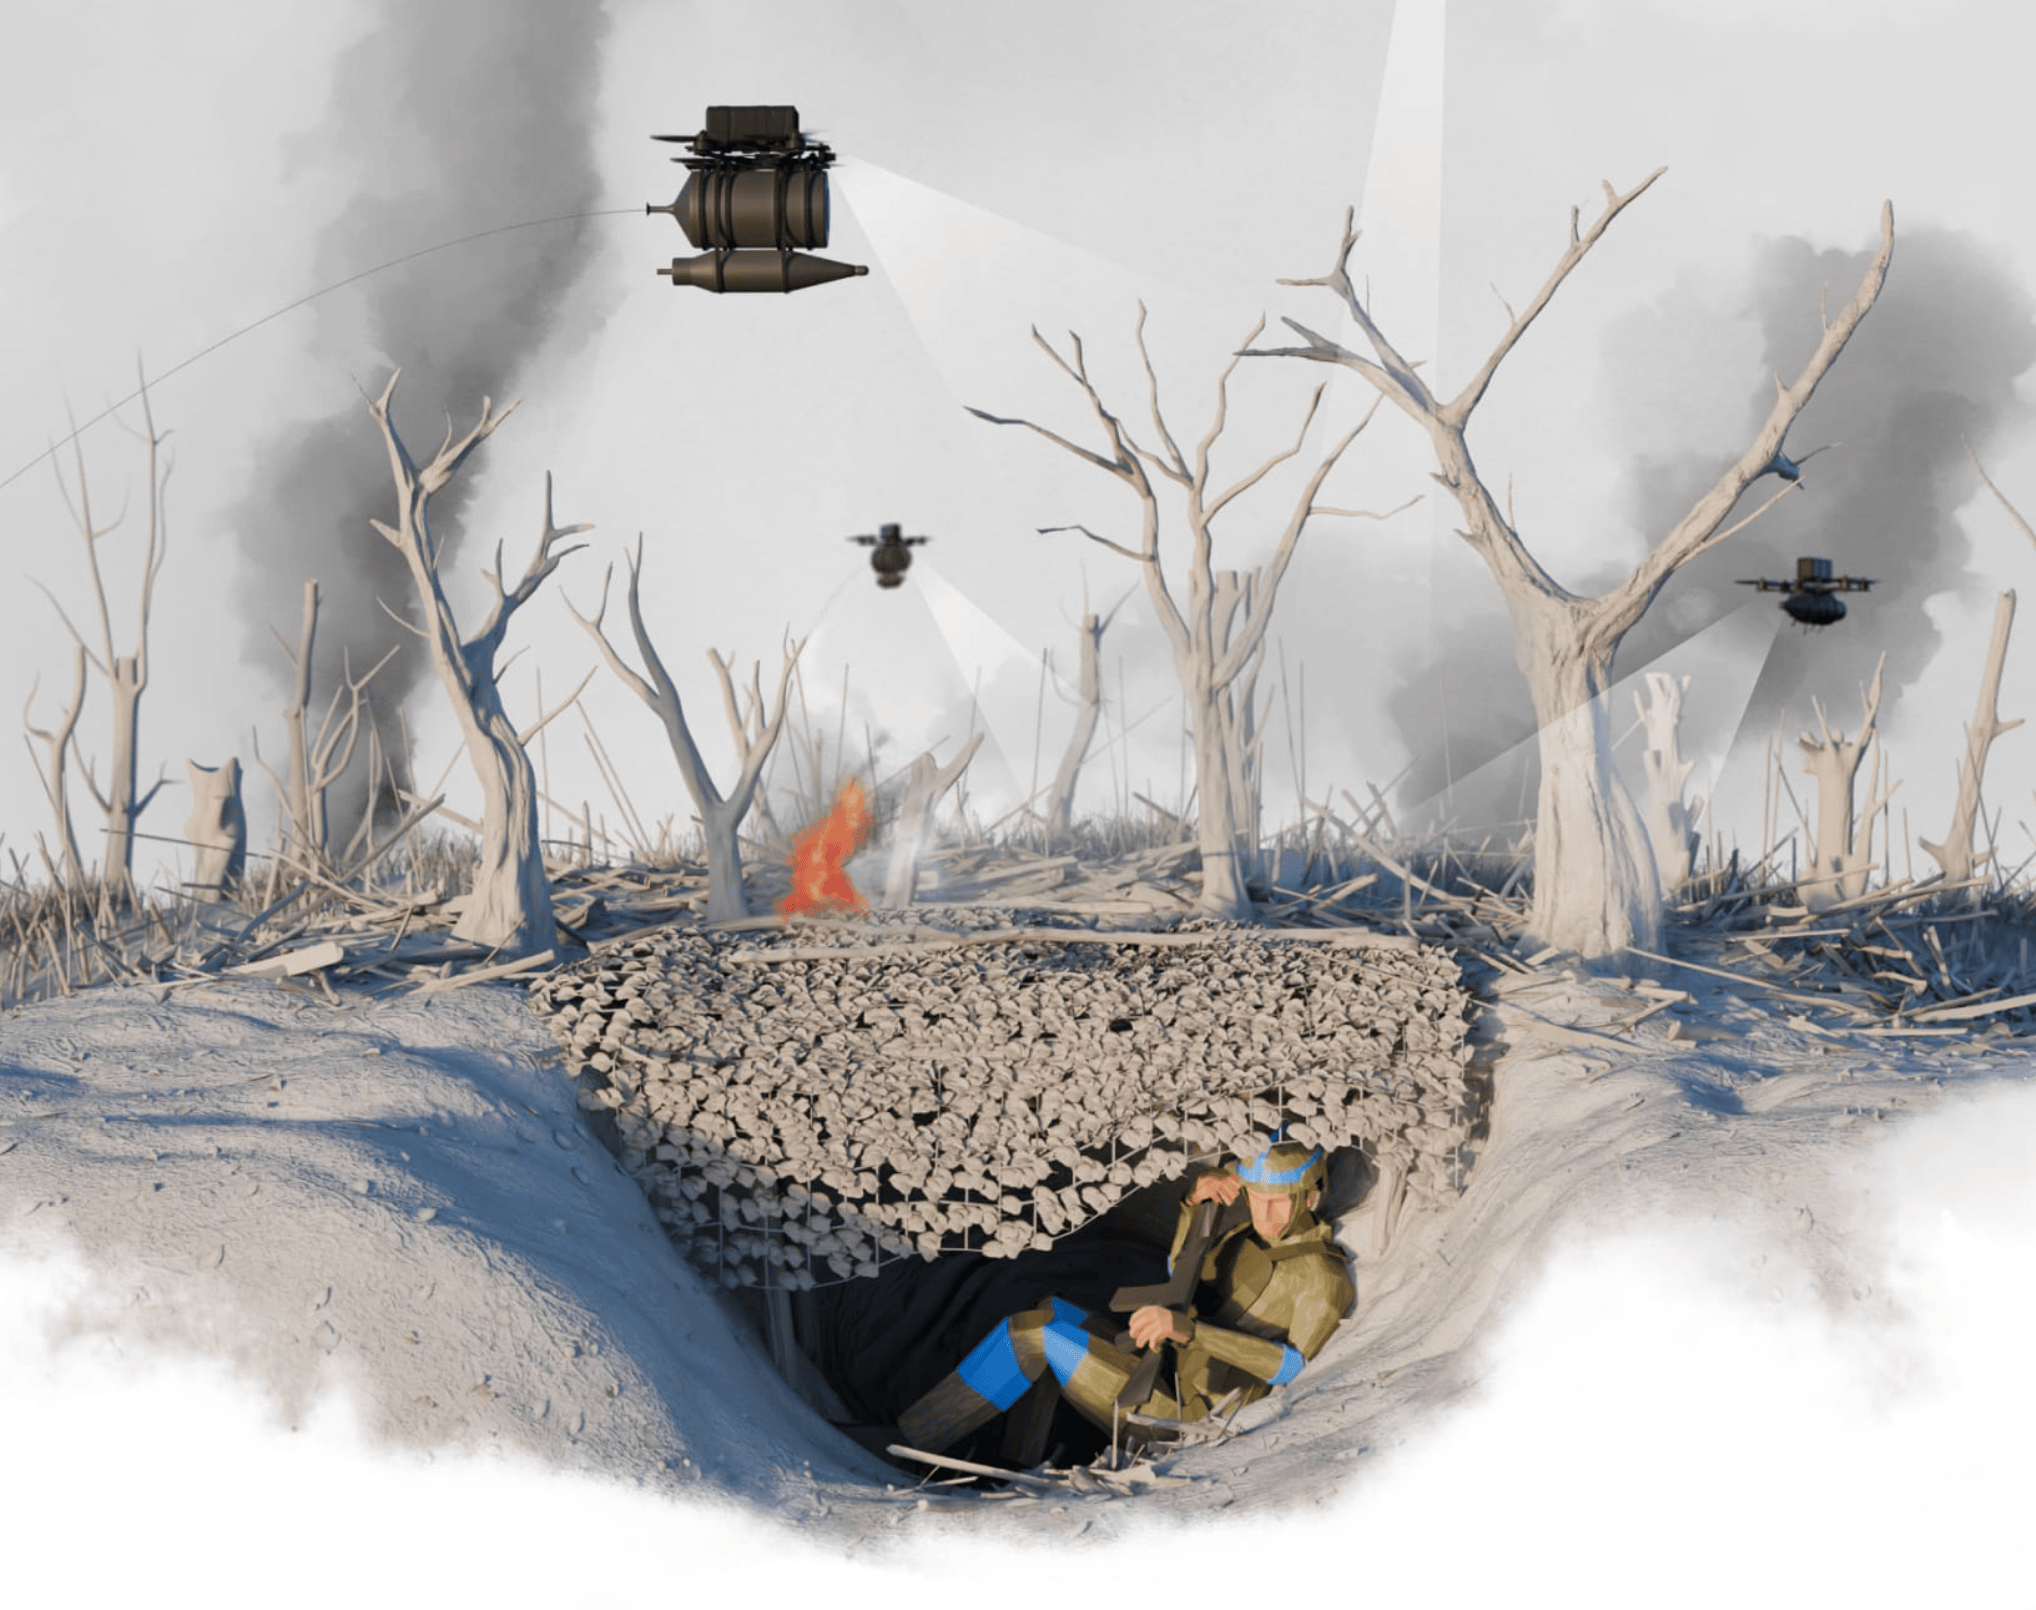
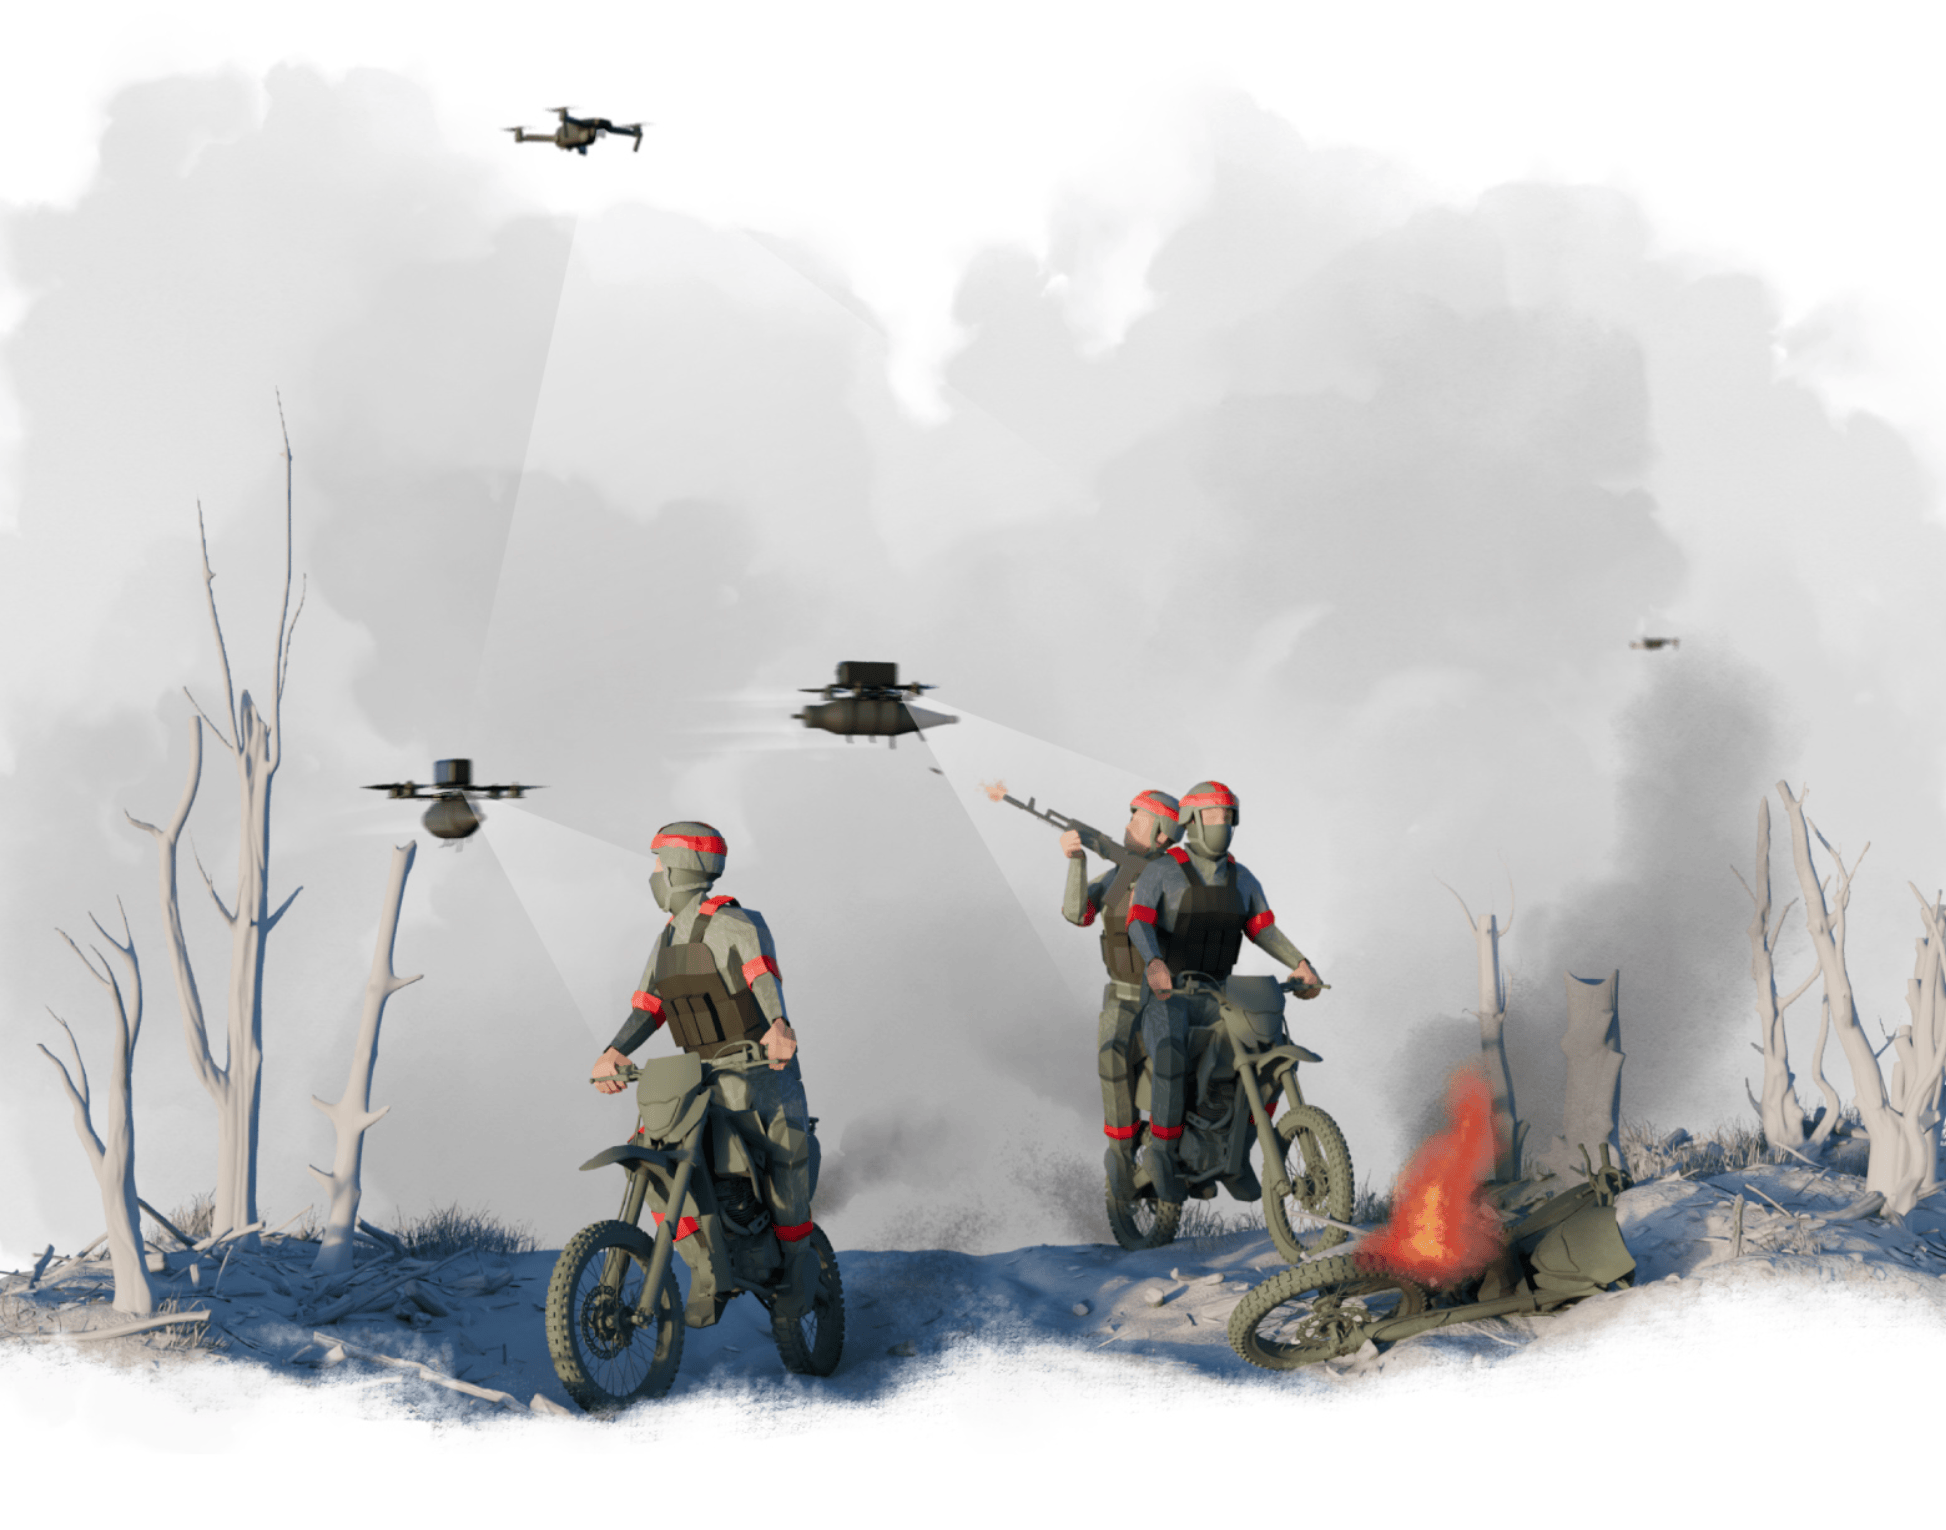
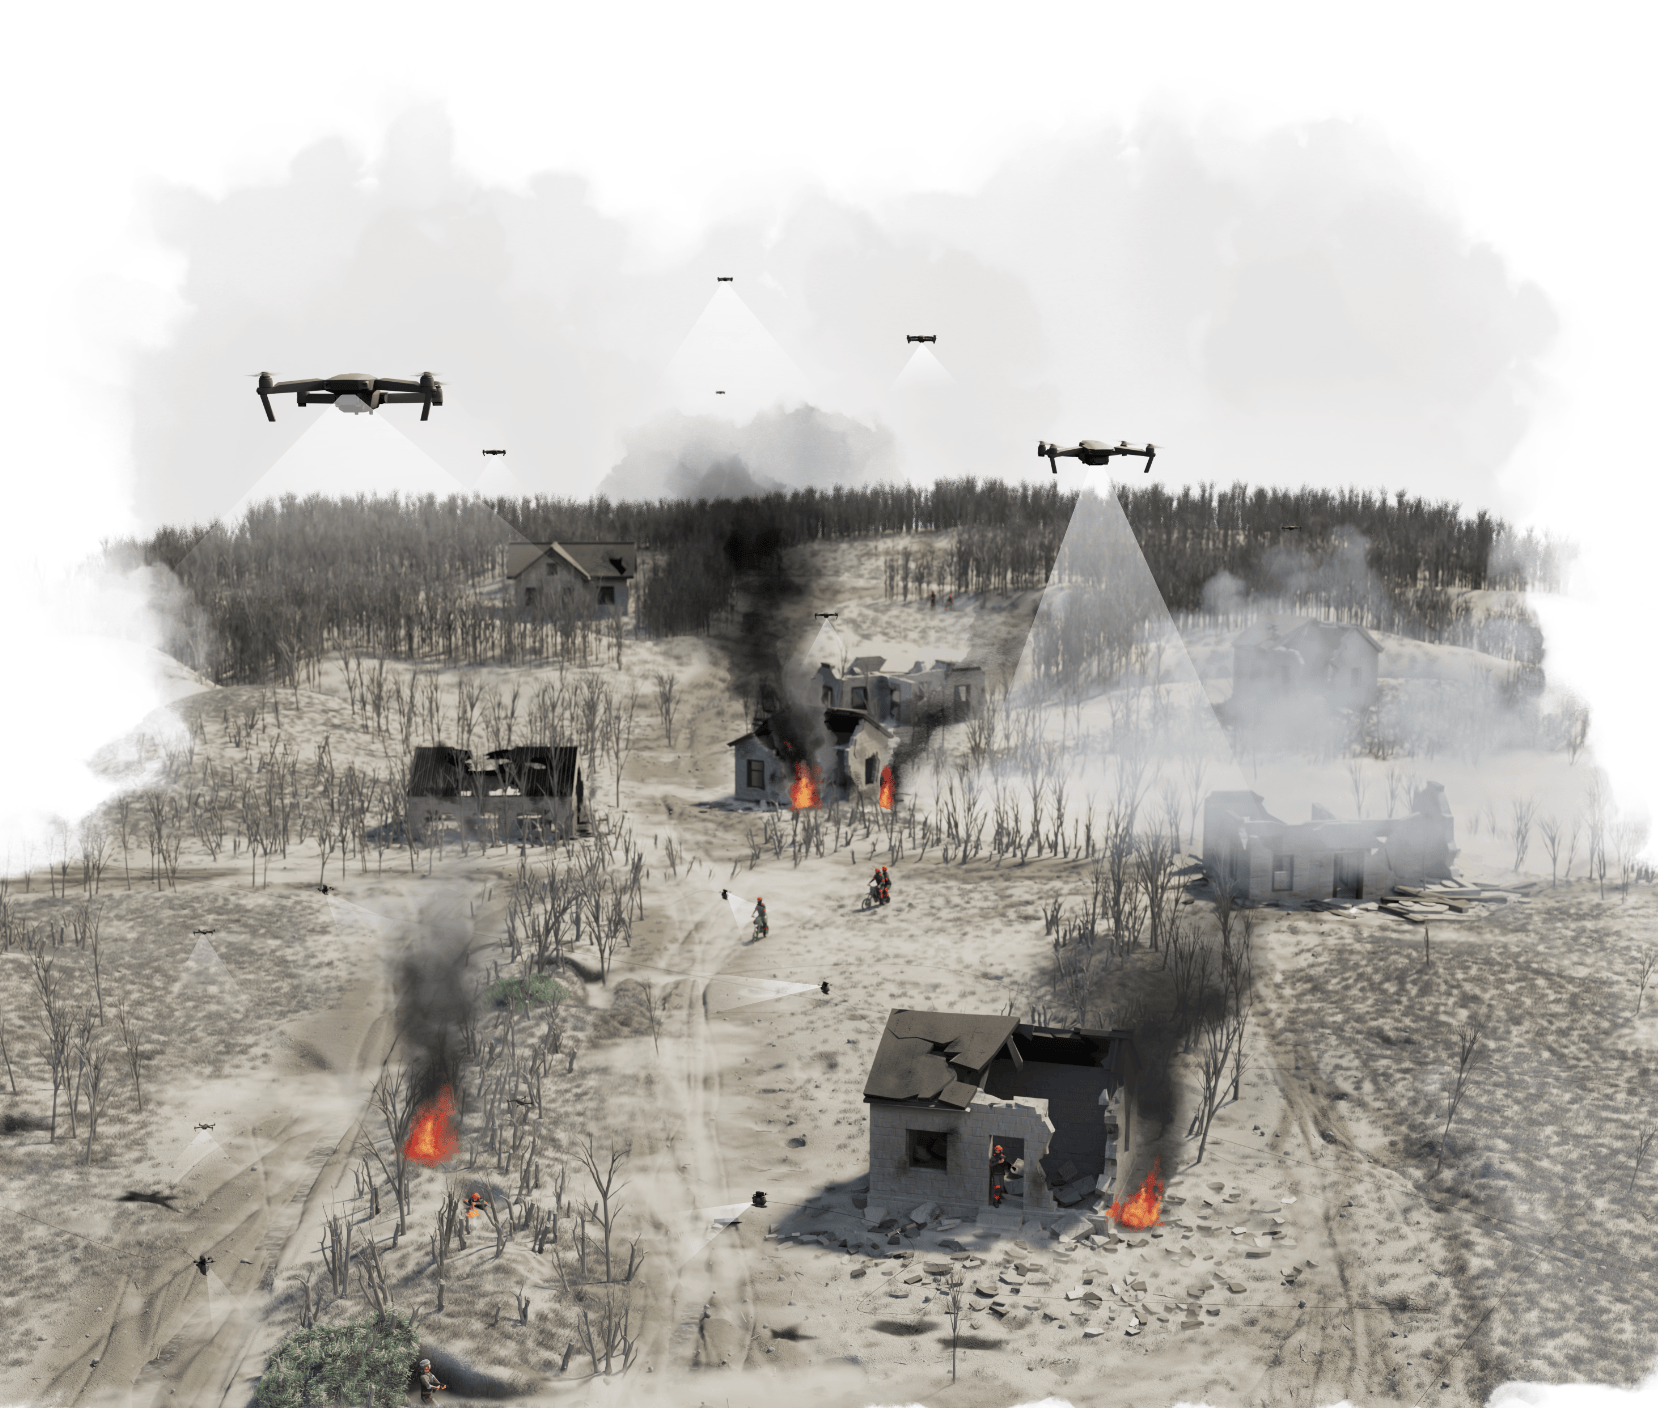
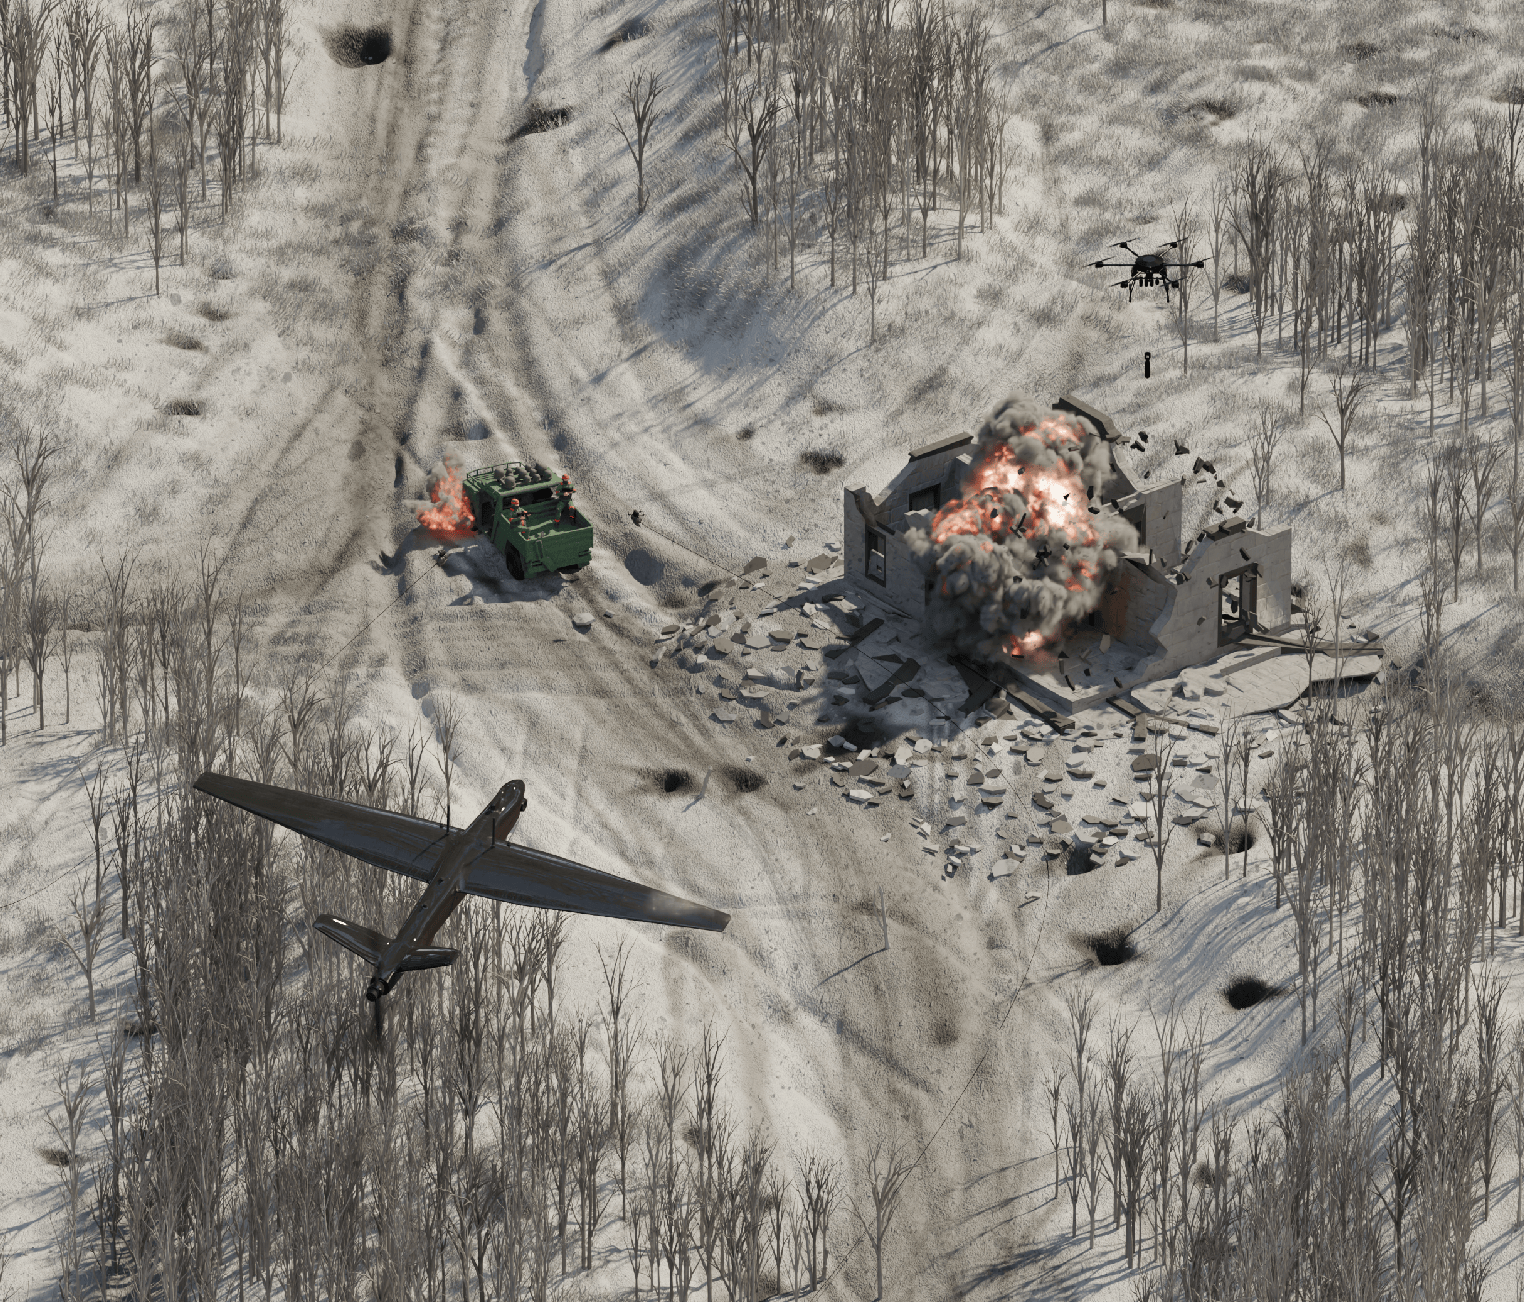
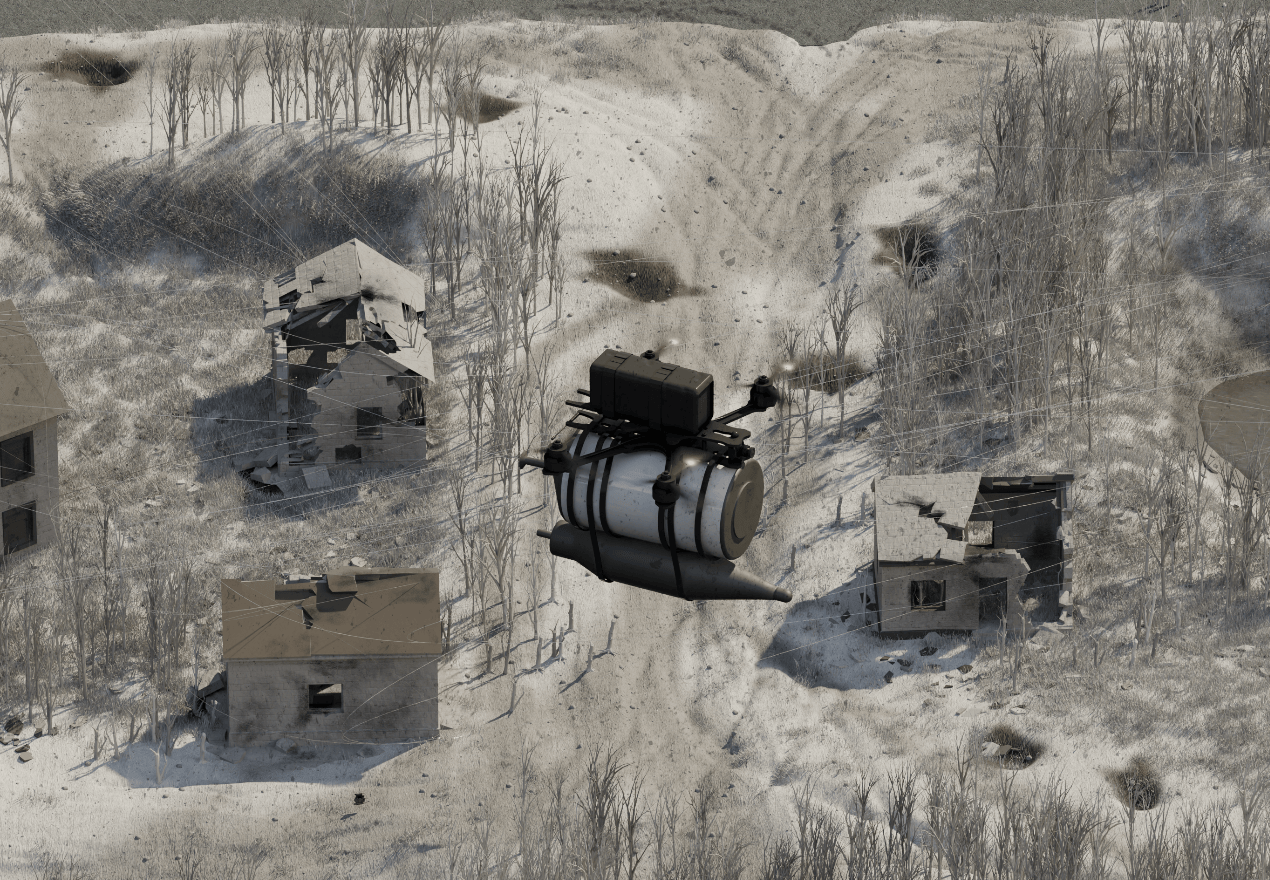
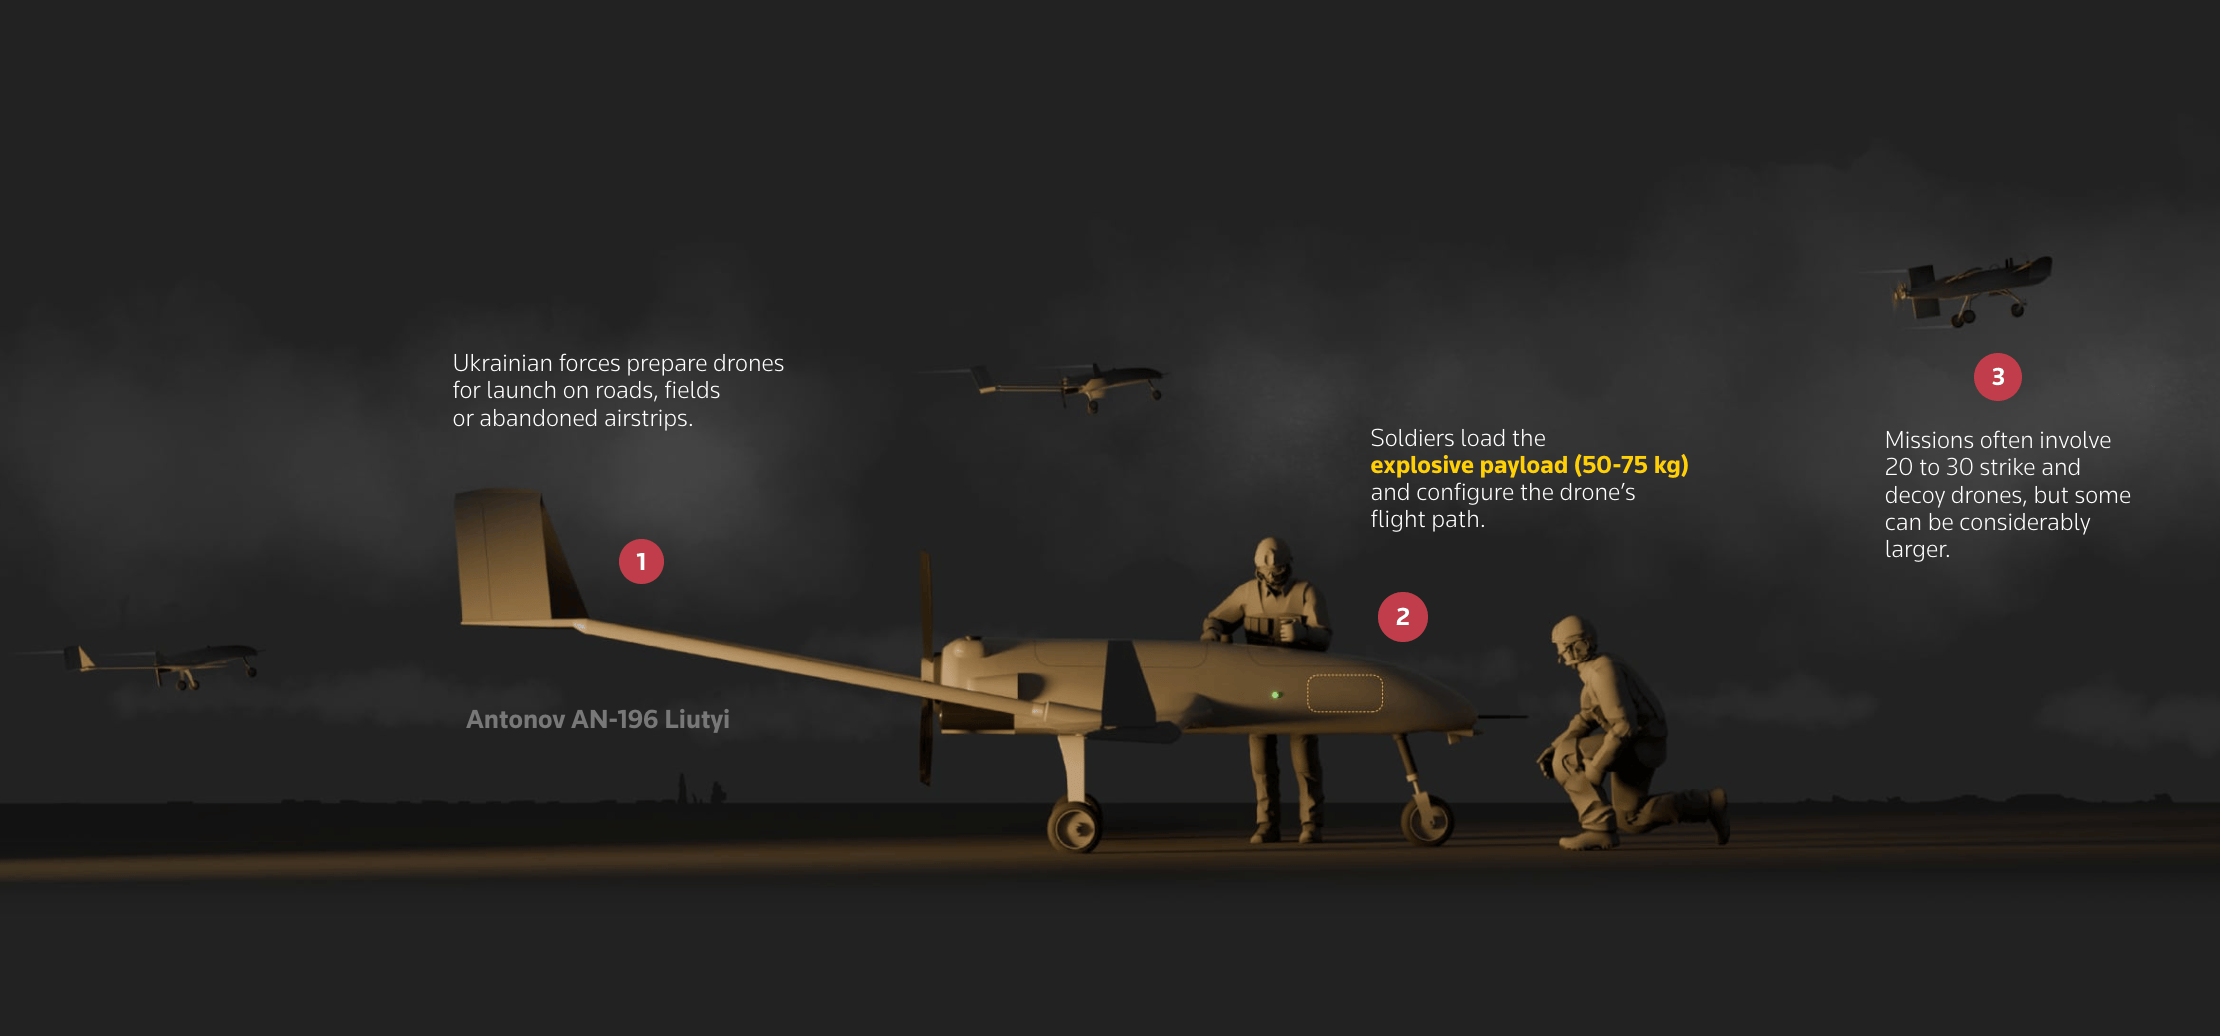
A Ukrainian soldier’s dramatic drone rescue
After 491 days on the front lines, a wounded soldier was carried 15 km to safety by a heavy-lift drone. A visual reconstruction of the rescue.
Graphics · 3D
Inside Russia’s new missile, ‘Oreshnik’
The technology behind the missile Russia presented as a new kind of hypersonic weapon.
Graphics · 3D
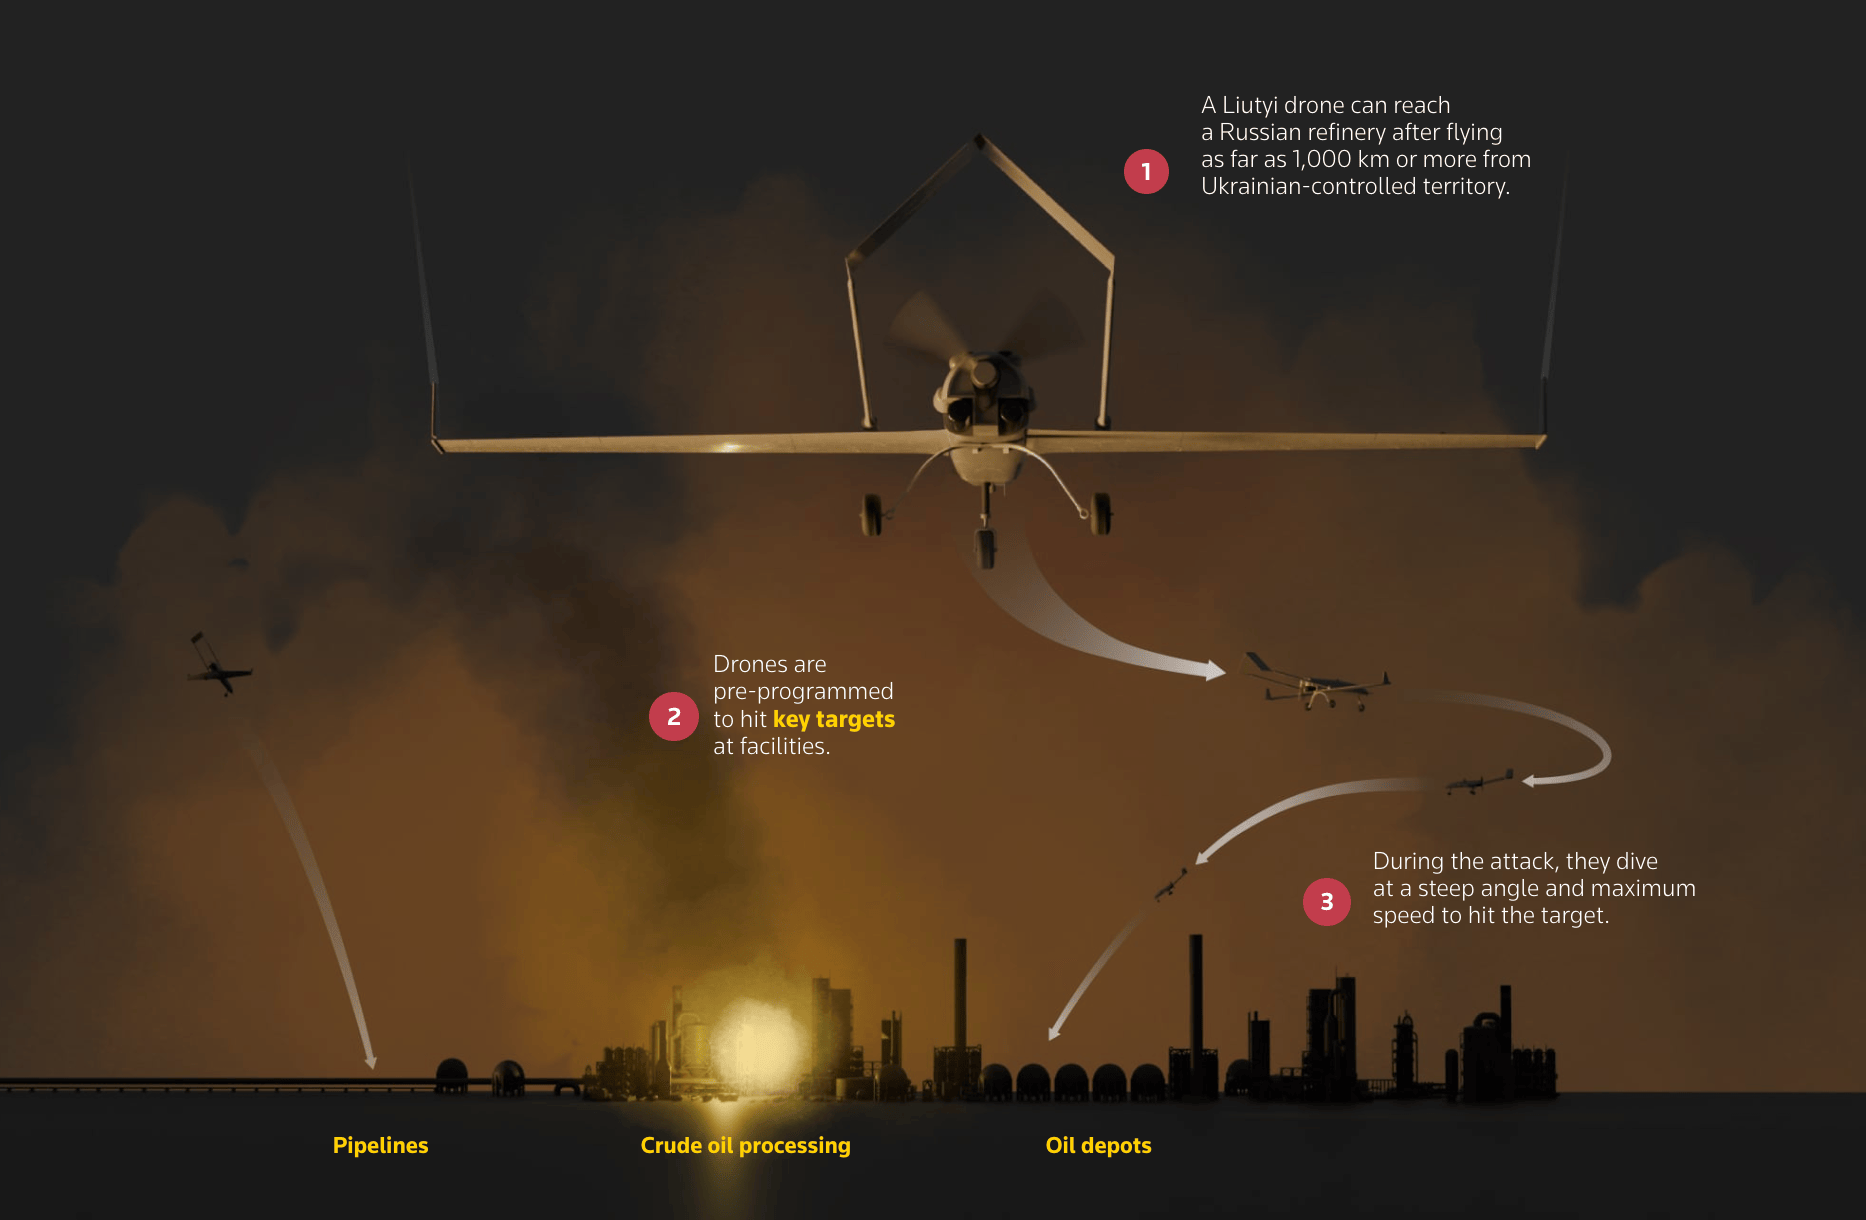
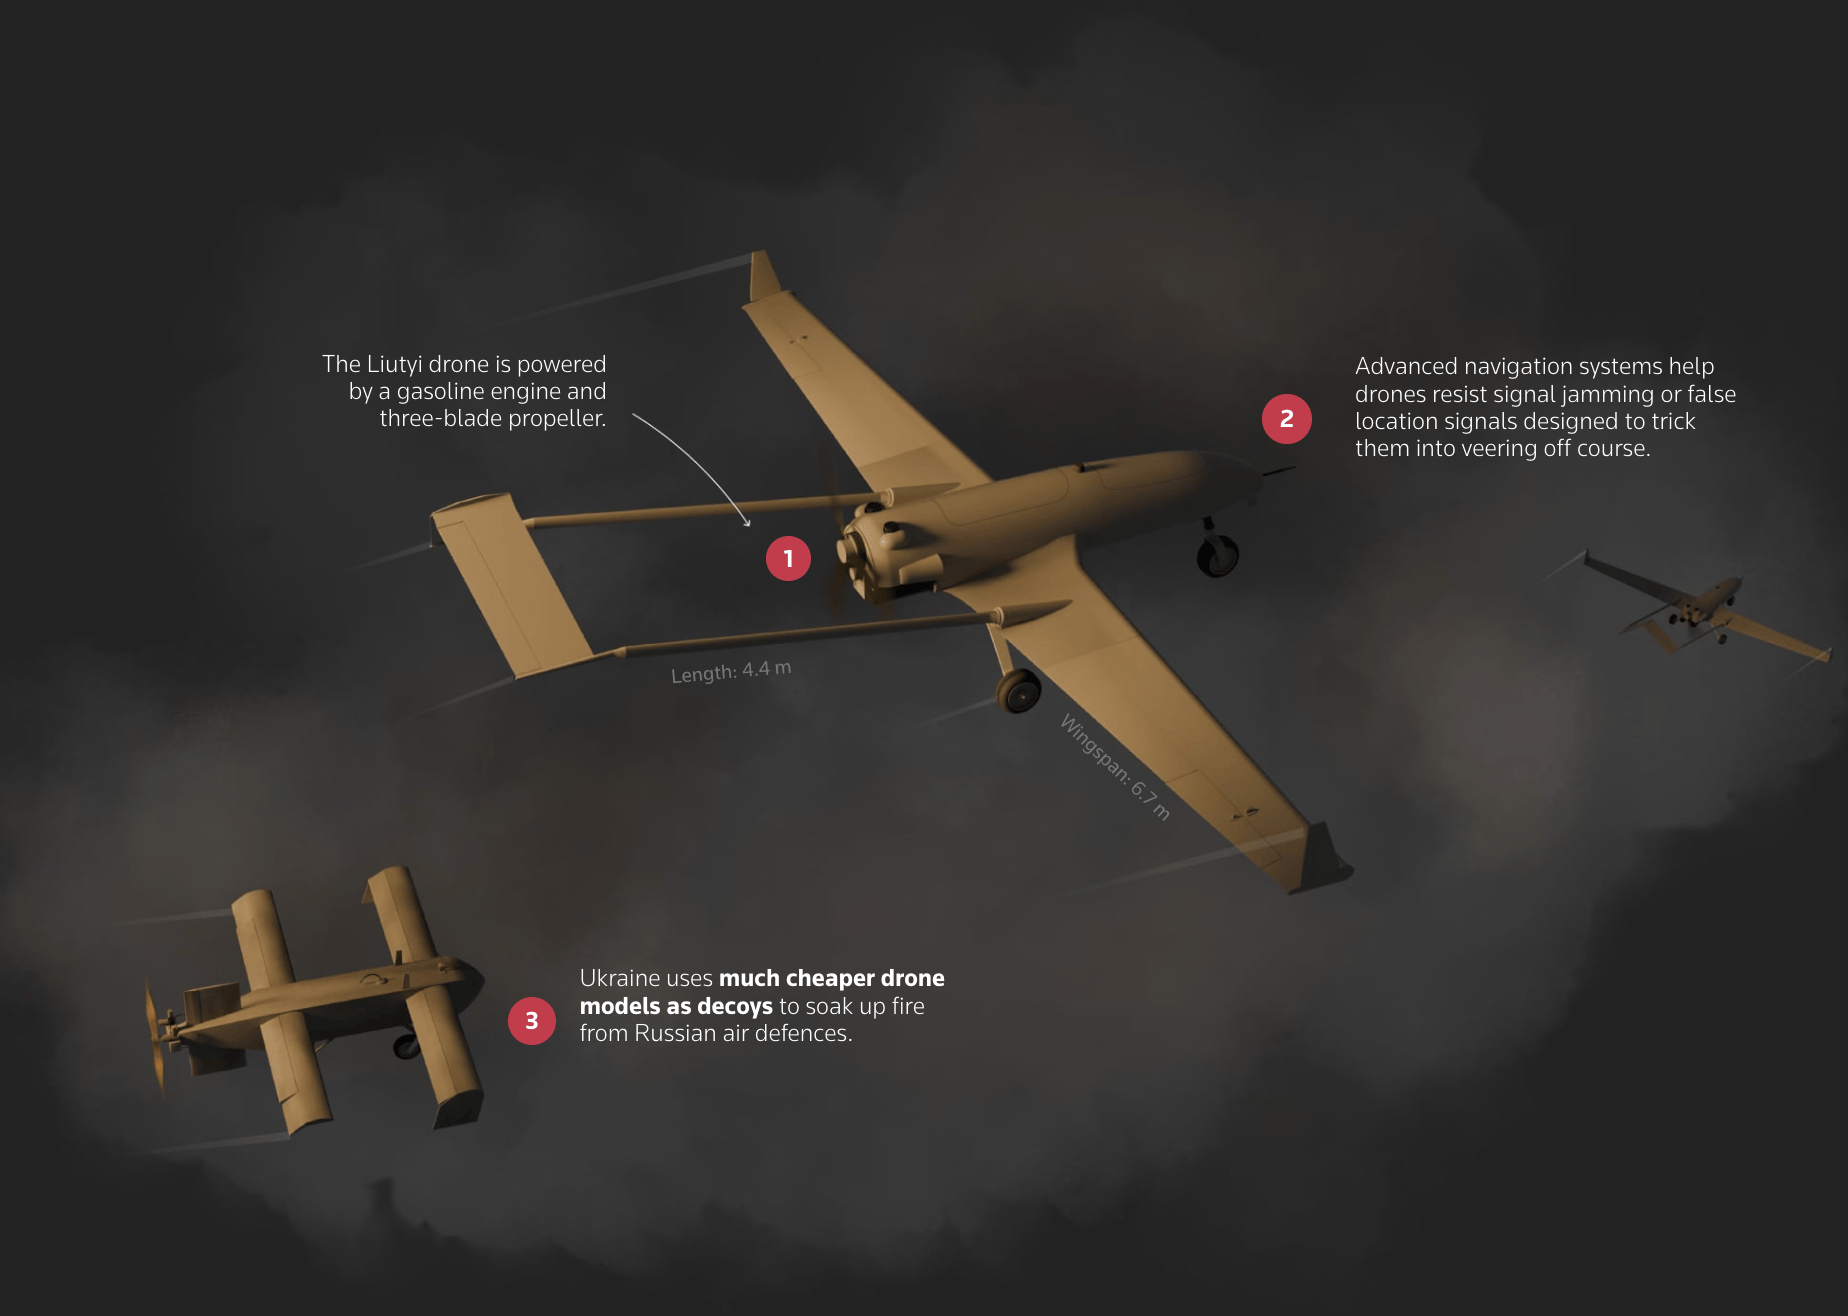
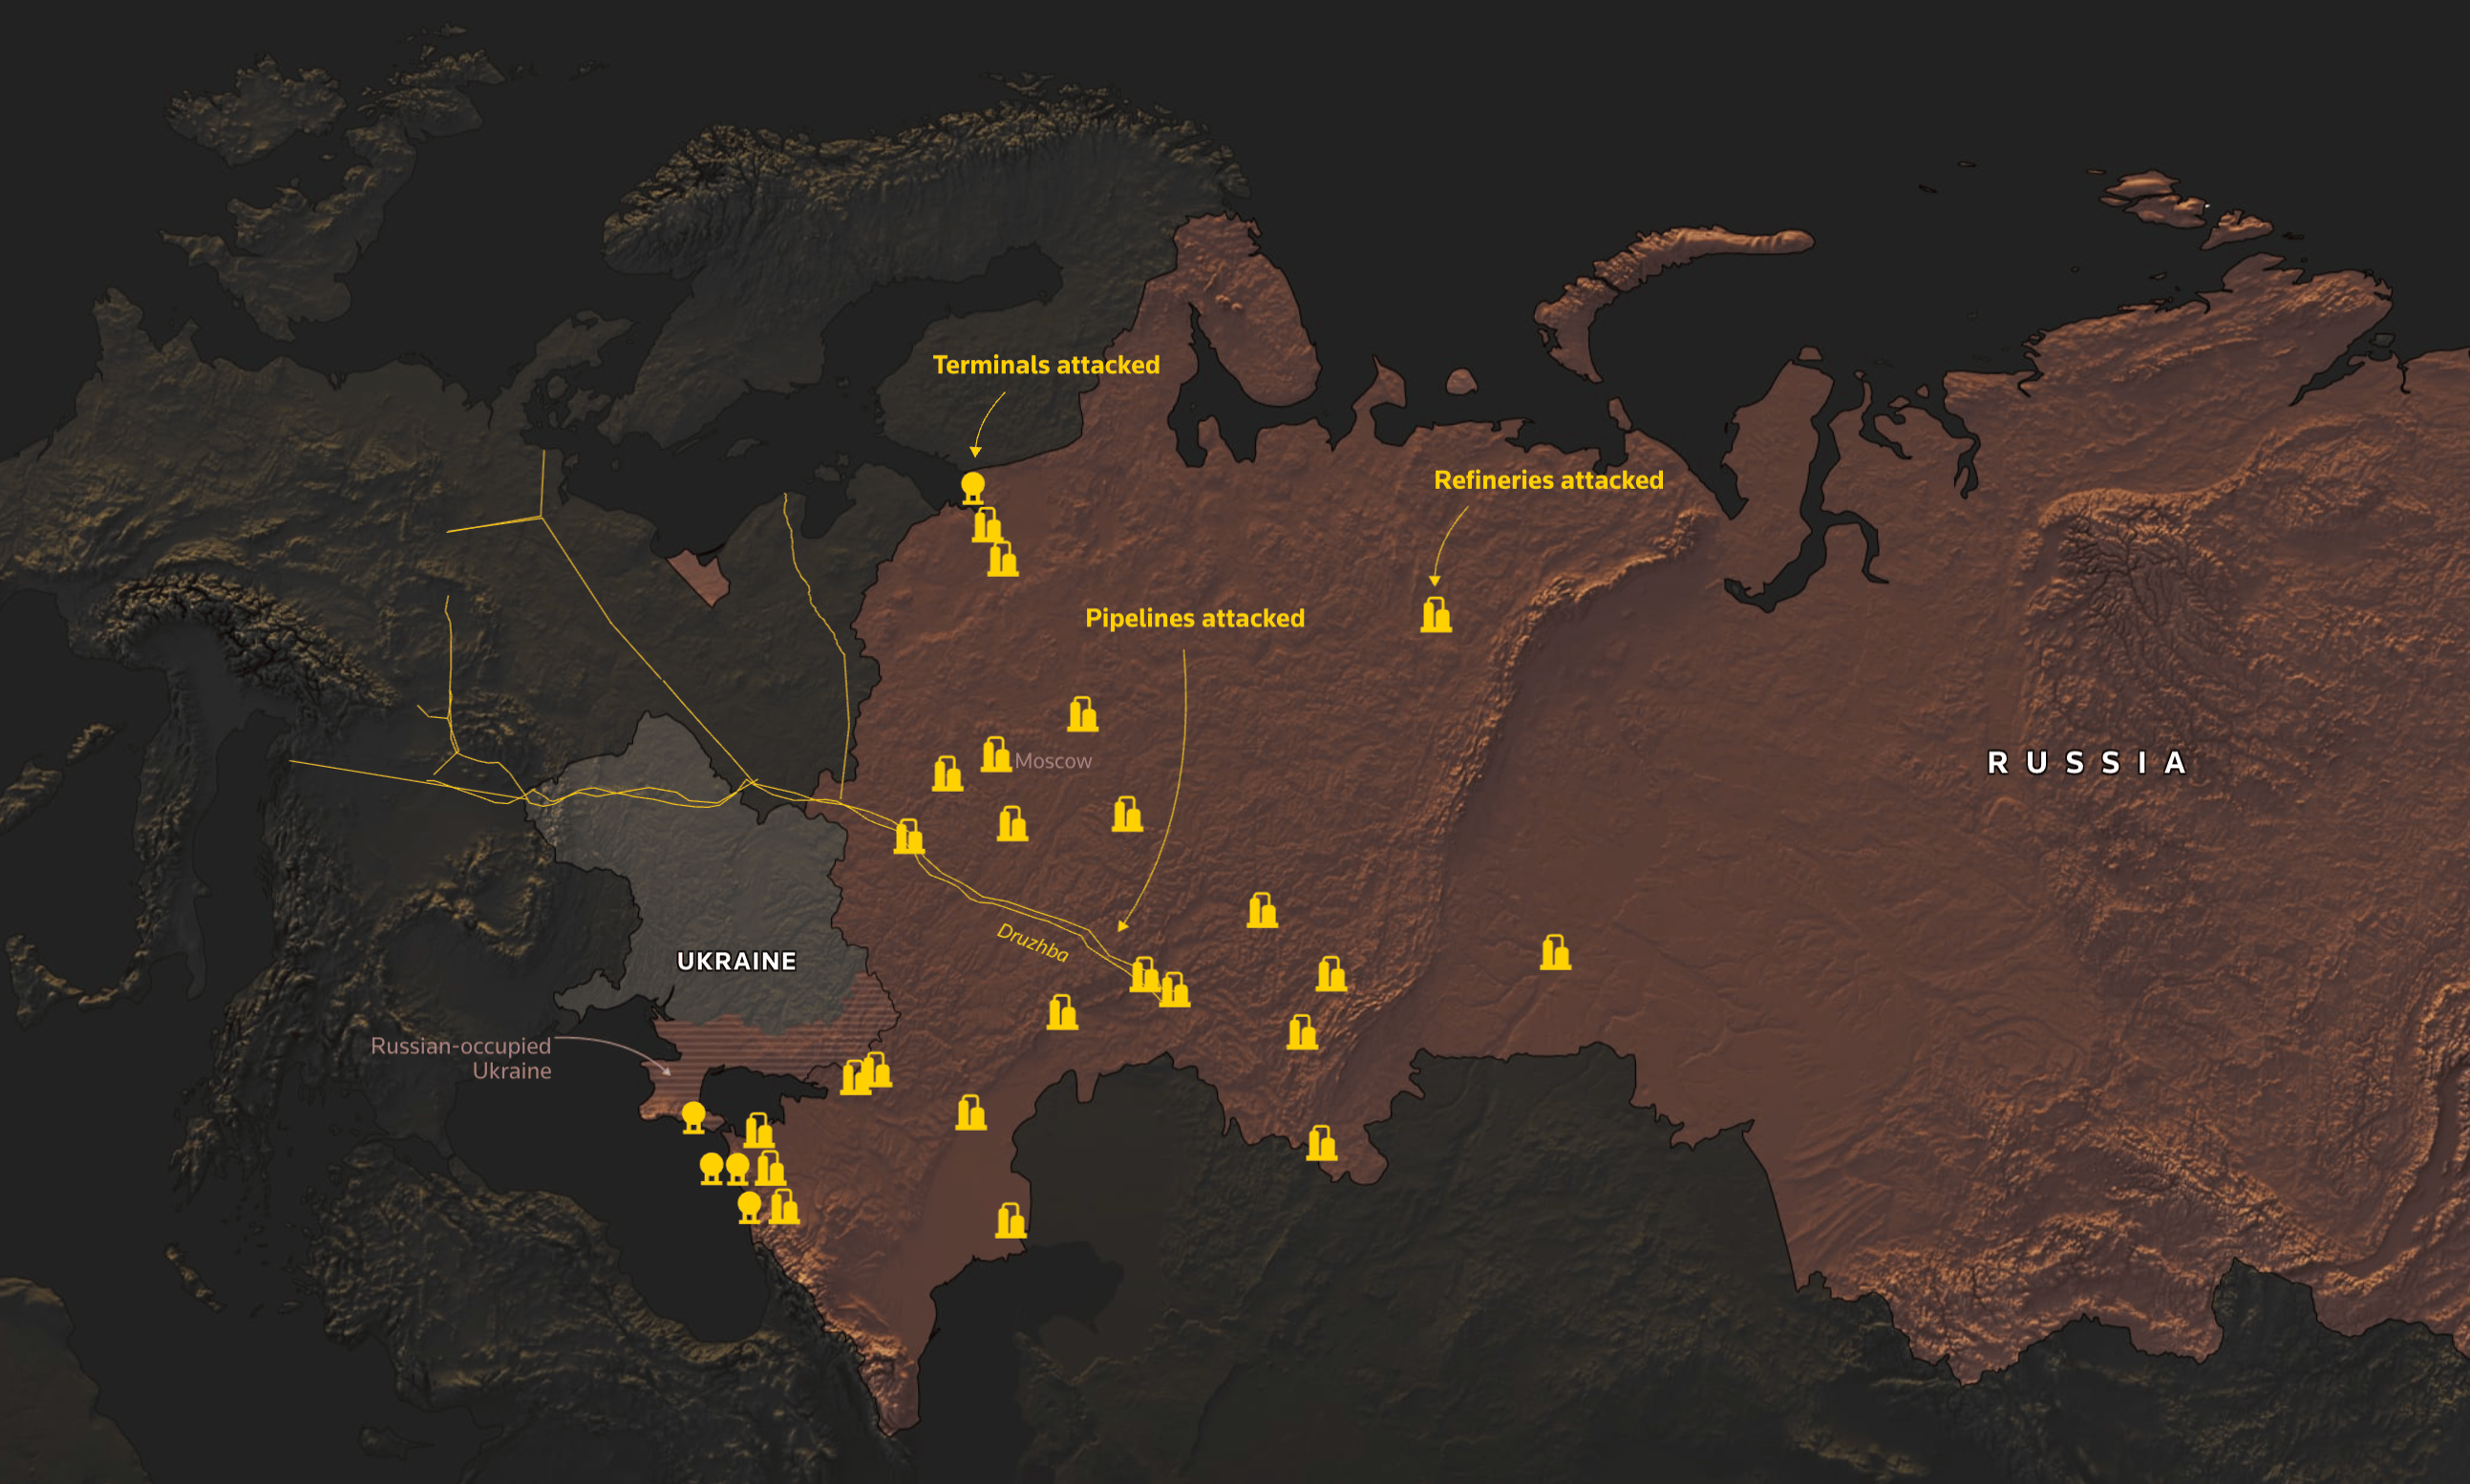
Ukrainian drone strikes choke Russian shipping in the Sea of Azov
Maps and satellite imagery reveal how attacks on vessels disrupted shipping through the Sea of Azov and the Kerch Strait.
Maps · Satellite imagery
US interest puts Greenland in focus
A closer look at Greenland through maps.
Maps
The air war over Ukraine
How F-16s could help Ukraine keep its air force flying and push opposing aircraft back.
Story · Graphics · 3D
How humans can and can’t catch bird flu
Scientists are watching for changes in the H5N1 virus that could allow it to spread more easily among humans.
Graphics · 3D
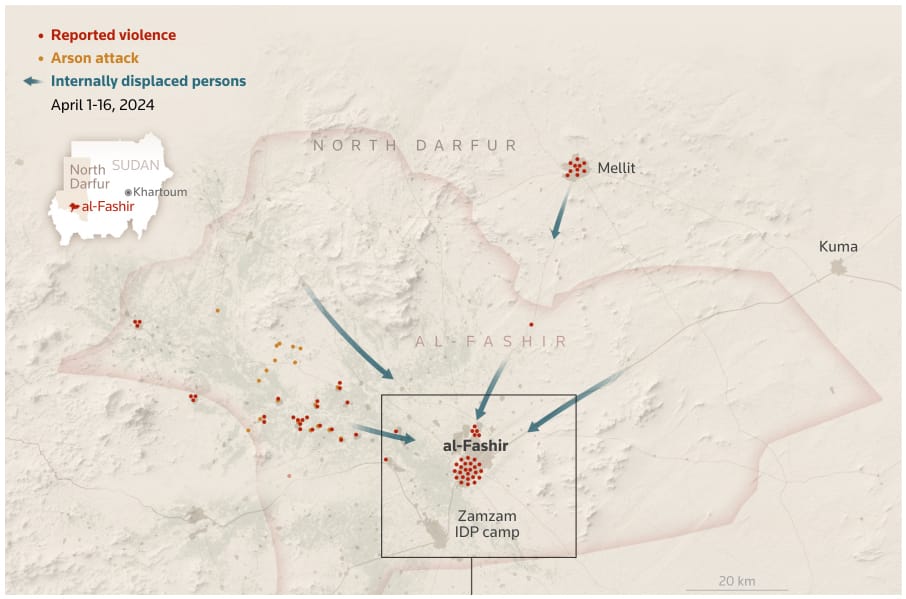
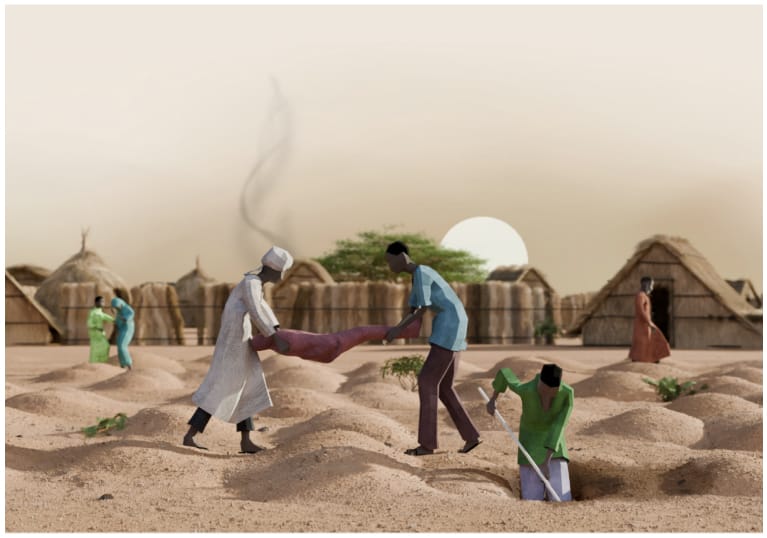
Violence engulfs besieged Zamzam camp in Sudan’s Darfur region
Maps explain the conflict surrounding the camp and its location in Sudan’s Darfur region.
Maps
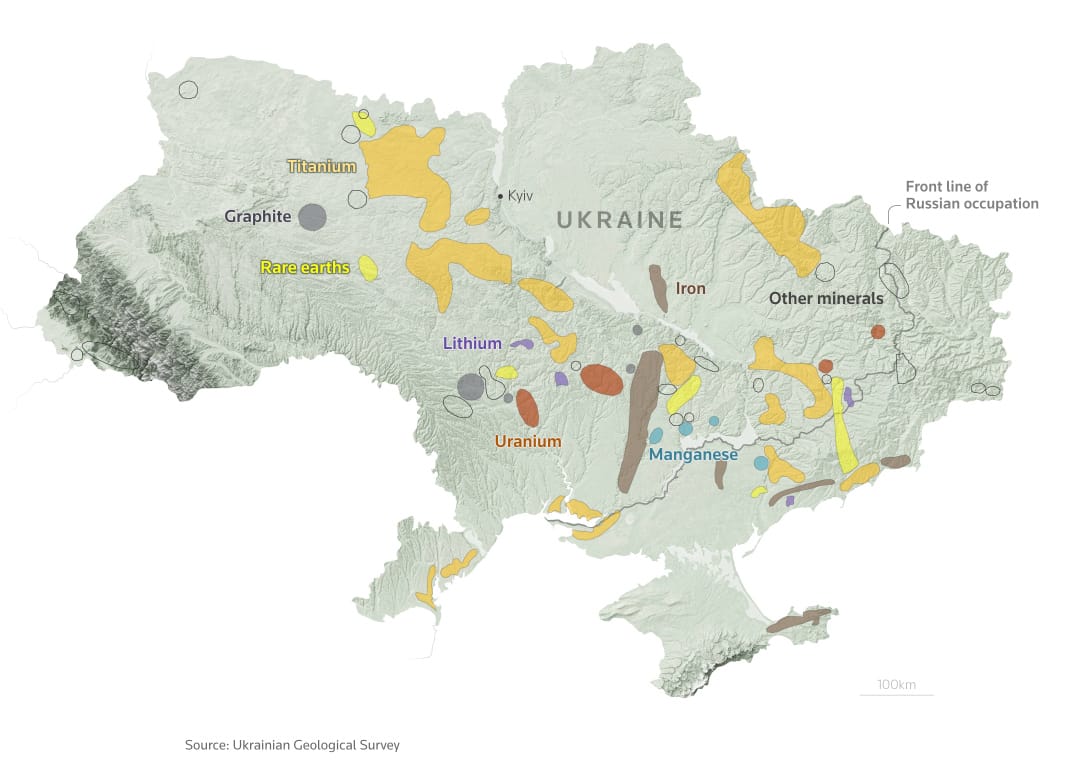
Ukraine’s minerals deal with the US
Mapping the resources at the center of an agreement announced without a security guarantee.
Maps
How Israel’s West Bank strategy aims to bury Palestinian statehood
A map-led examination of Israel’s strategy in the West Bank and its implications for Palestinian statehood.
Maps
How Israel’s Iron Dome protects its cities
A visual explanation of how the air defence system detects, tracks and intercepts incoming rockets.
Graphics · 3D
Four factors that stalled Ukraine’s counteroffensive
A visual analysis of the obstacles that slowed Ukraine’s advance.
Story · Graphics · 3D
The destruction of Gaza
New analysis shows the scale of destruction from Israel’s campaign across Gaza.
Story · Graphics · 3D
How long does it take to catch coronavirus depending on the type of mask you’re wearing?
Concept · Graphics
How to read the signs of an eruption
Uncovering the secrets of La Palma’s volcano.
Concept · Graphics
Is Putin losing the war? The balance of the first phase of the conflict in Ukraine
Concept · Graphics
What is the likelihood of a nuclear attack?
A visual explanation of the threat of a nuclear attack by Russia.
Concept · Graphics
Coches a 80 grados y parques infantiles a 65
descubra las temperaturas extremas que lo rodean
Concept · Graphics · Reporting and text
Cuevas y túneles impenetrables en la zona arrasada por el volcán de La Palma
Graphics
Así afronta España el cierre del gasoducto del Magreb
Design · Graphics
Ríos imposibles
Las 171.000 barreras que rompen el curso de agua en España.
Maps · Graphics
Ómicron
así es el “Frankenstein” del coronavirus que atemoriza al planeta
Graphics · Animation
Avoiding coronavirus infection in indoor spaces
don’t breathe other people’s air
Concept · Graphics
Why 14 million Spaniards are at risk from earthquakes
Maps · Data · Graphics
Siete ventajas que hacen del Leopard 2 el mejor tanque para la guerra de Ucrania
Story · Reporting · Graphics
The unvaccinated US teacher who infected 12 students with Covid
Lessons to be learned for the return to school
Concept · Graphics
Los mil días de oro
así es el desarrollo de tu bebé en los primeros dos años de vida, mes a mes
3D graphics · Concept · Reporting
Mi vida con placas solares
pendiente del sol para poner la lavadora
3D graphics
Cómo un escape de una tubería de gas en la calle hizo saltar por los aires un edificio en Madrid
3D graphics · Animation
Así consigue un laboratorio multiplicar por 1.000 el precio de un medicamento
Graphics · Animations · 3D
Recorrido visual por las investiduras de EE UU
Trump rompe 150 años de tradición democrática
3D graphics · Maps
Isolate fast and curtail infection
how antigen tests are changing the face of the pandemic
3D · Design · Graphics
Un paseo por la Gran Vía de la crisis
casi un 30% de negocios cerrados
Data · Design · Graphics
Coronavirus
How infected air can flow from one apartment to another
Story · Graphics
Supermanzanas, o cómo devolver al peatón la ciudad robada por los coches
3D · Design · Graphics
An analysis of three Covid-19 outbreaks
how they happened and how they can be avoided
Concept · Graphics · 3D
ccu cgg cgg gca. The 12 letters that changed the world
Graphics · Design
Boeing 737 MAX: A tale of two crashes
An analysis of official interim crash reports reveals the parallels between two Boeing 737 MAX accidents.
Concept · Design · Animation
The Incredible Inventory of Things We’ve Put on the Moon
A visual inventory of objects left on the lunar surface, including equipment from the Apollo 16 mission in 1972.
Story · Research · Design
Fire Ravages Notre Dame Cathedral
The cathedral sustained massive damage, but authorities said its basic structure had been salvaged.
Mockup · 3D
Why tornadoes are so hard to forecast
Scientists have gained new knowledge about how tornadoes form, but gaps in their understanding still make forecasting difficult.
Concept · Illustration